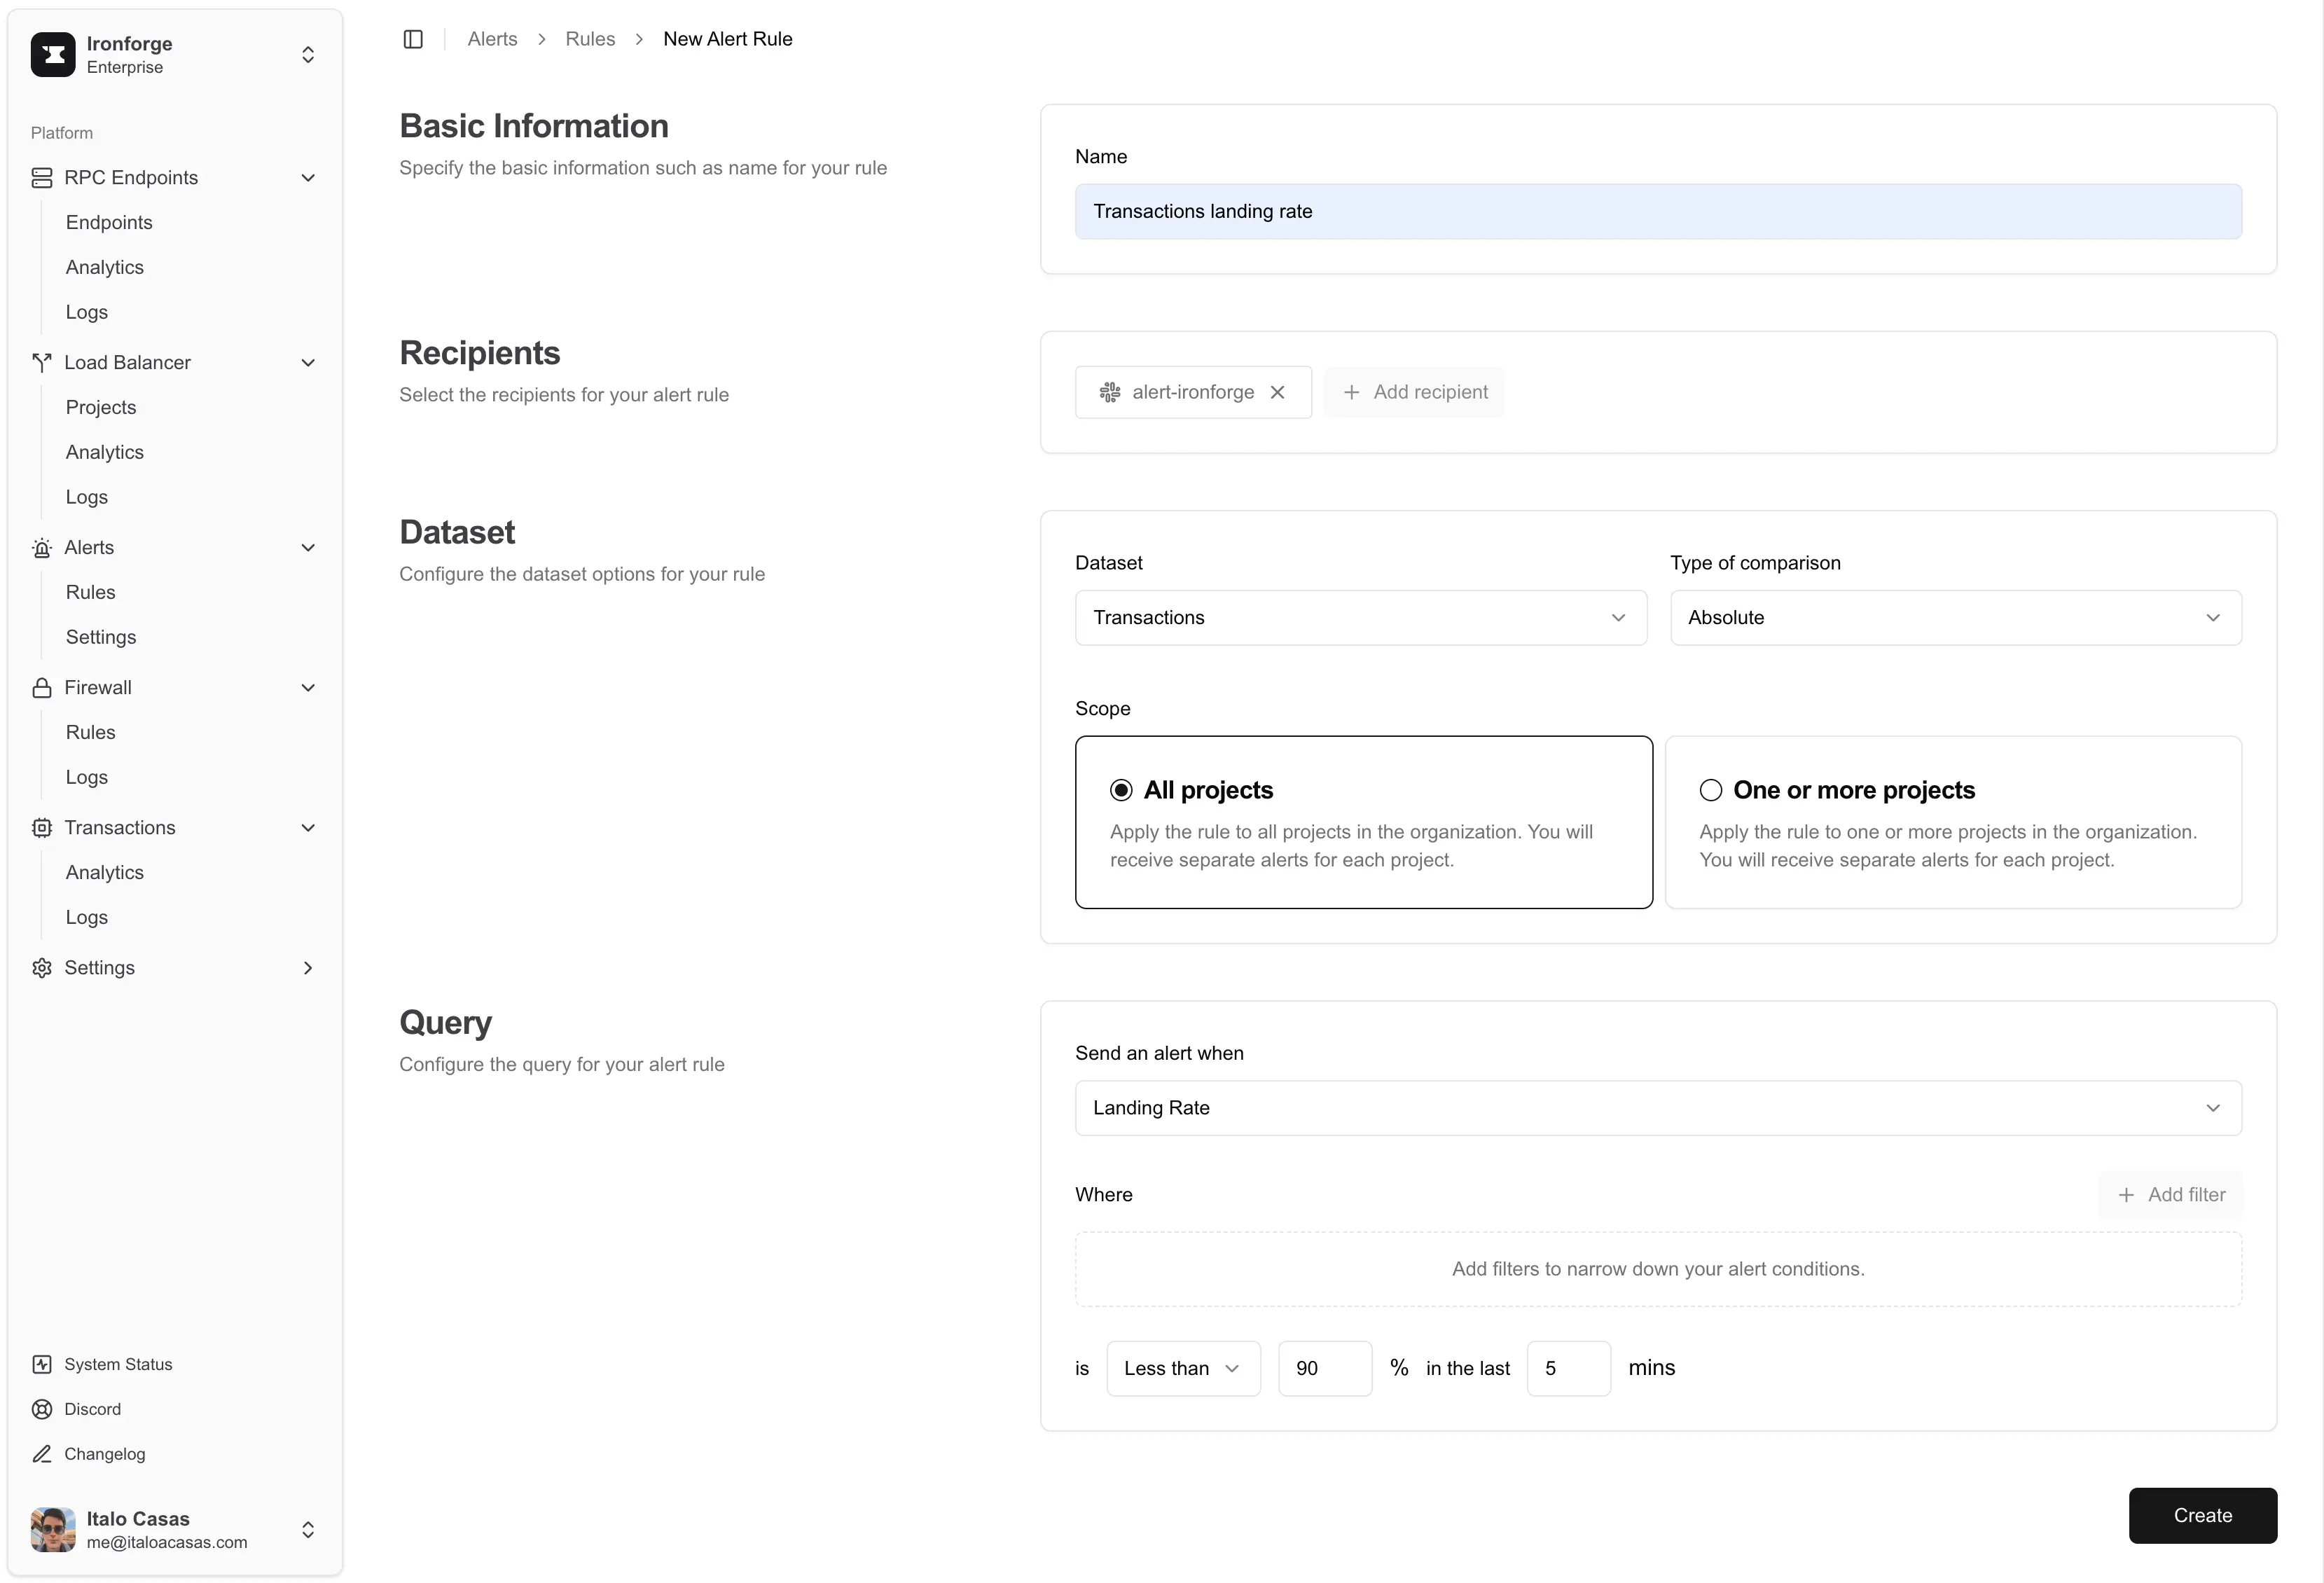
We're thrilled to launch our most requested feature: Alerts.
With alerts, you can now monitor the health of your RPC endpoints, load balancer, and transactions, and be notified when something is wrong in Slack, PagerDuty, and more.
To find out more about alerts go to the Alerts section and read our Alerts documentation.
While alerts are in public beta, we'd love to hear from you. Please share your feedback on our Discord or Twitter.

Improved UX
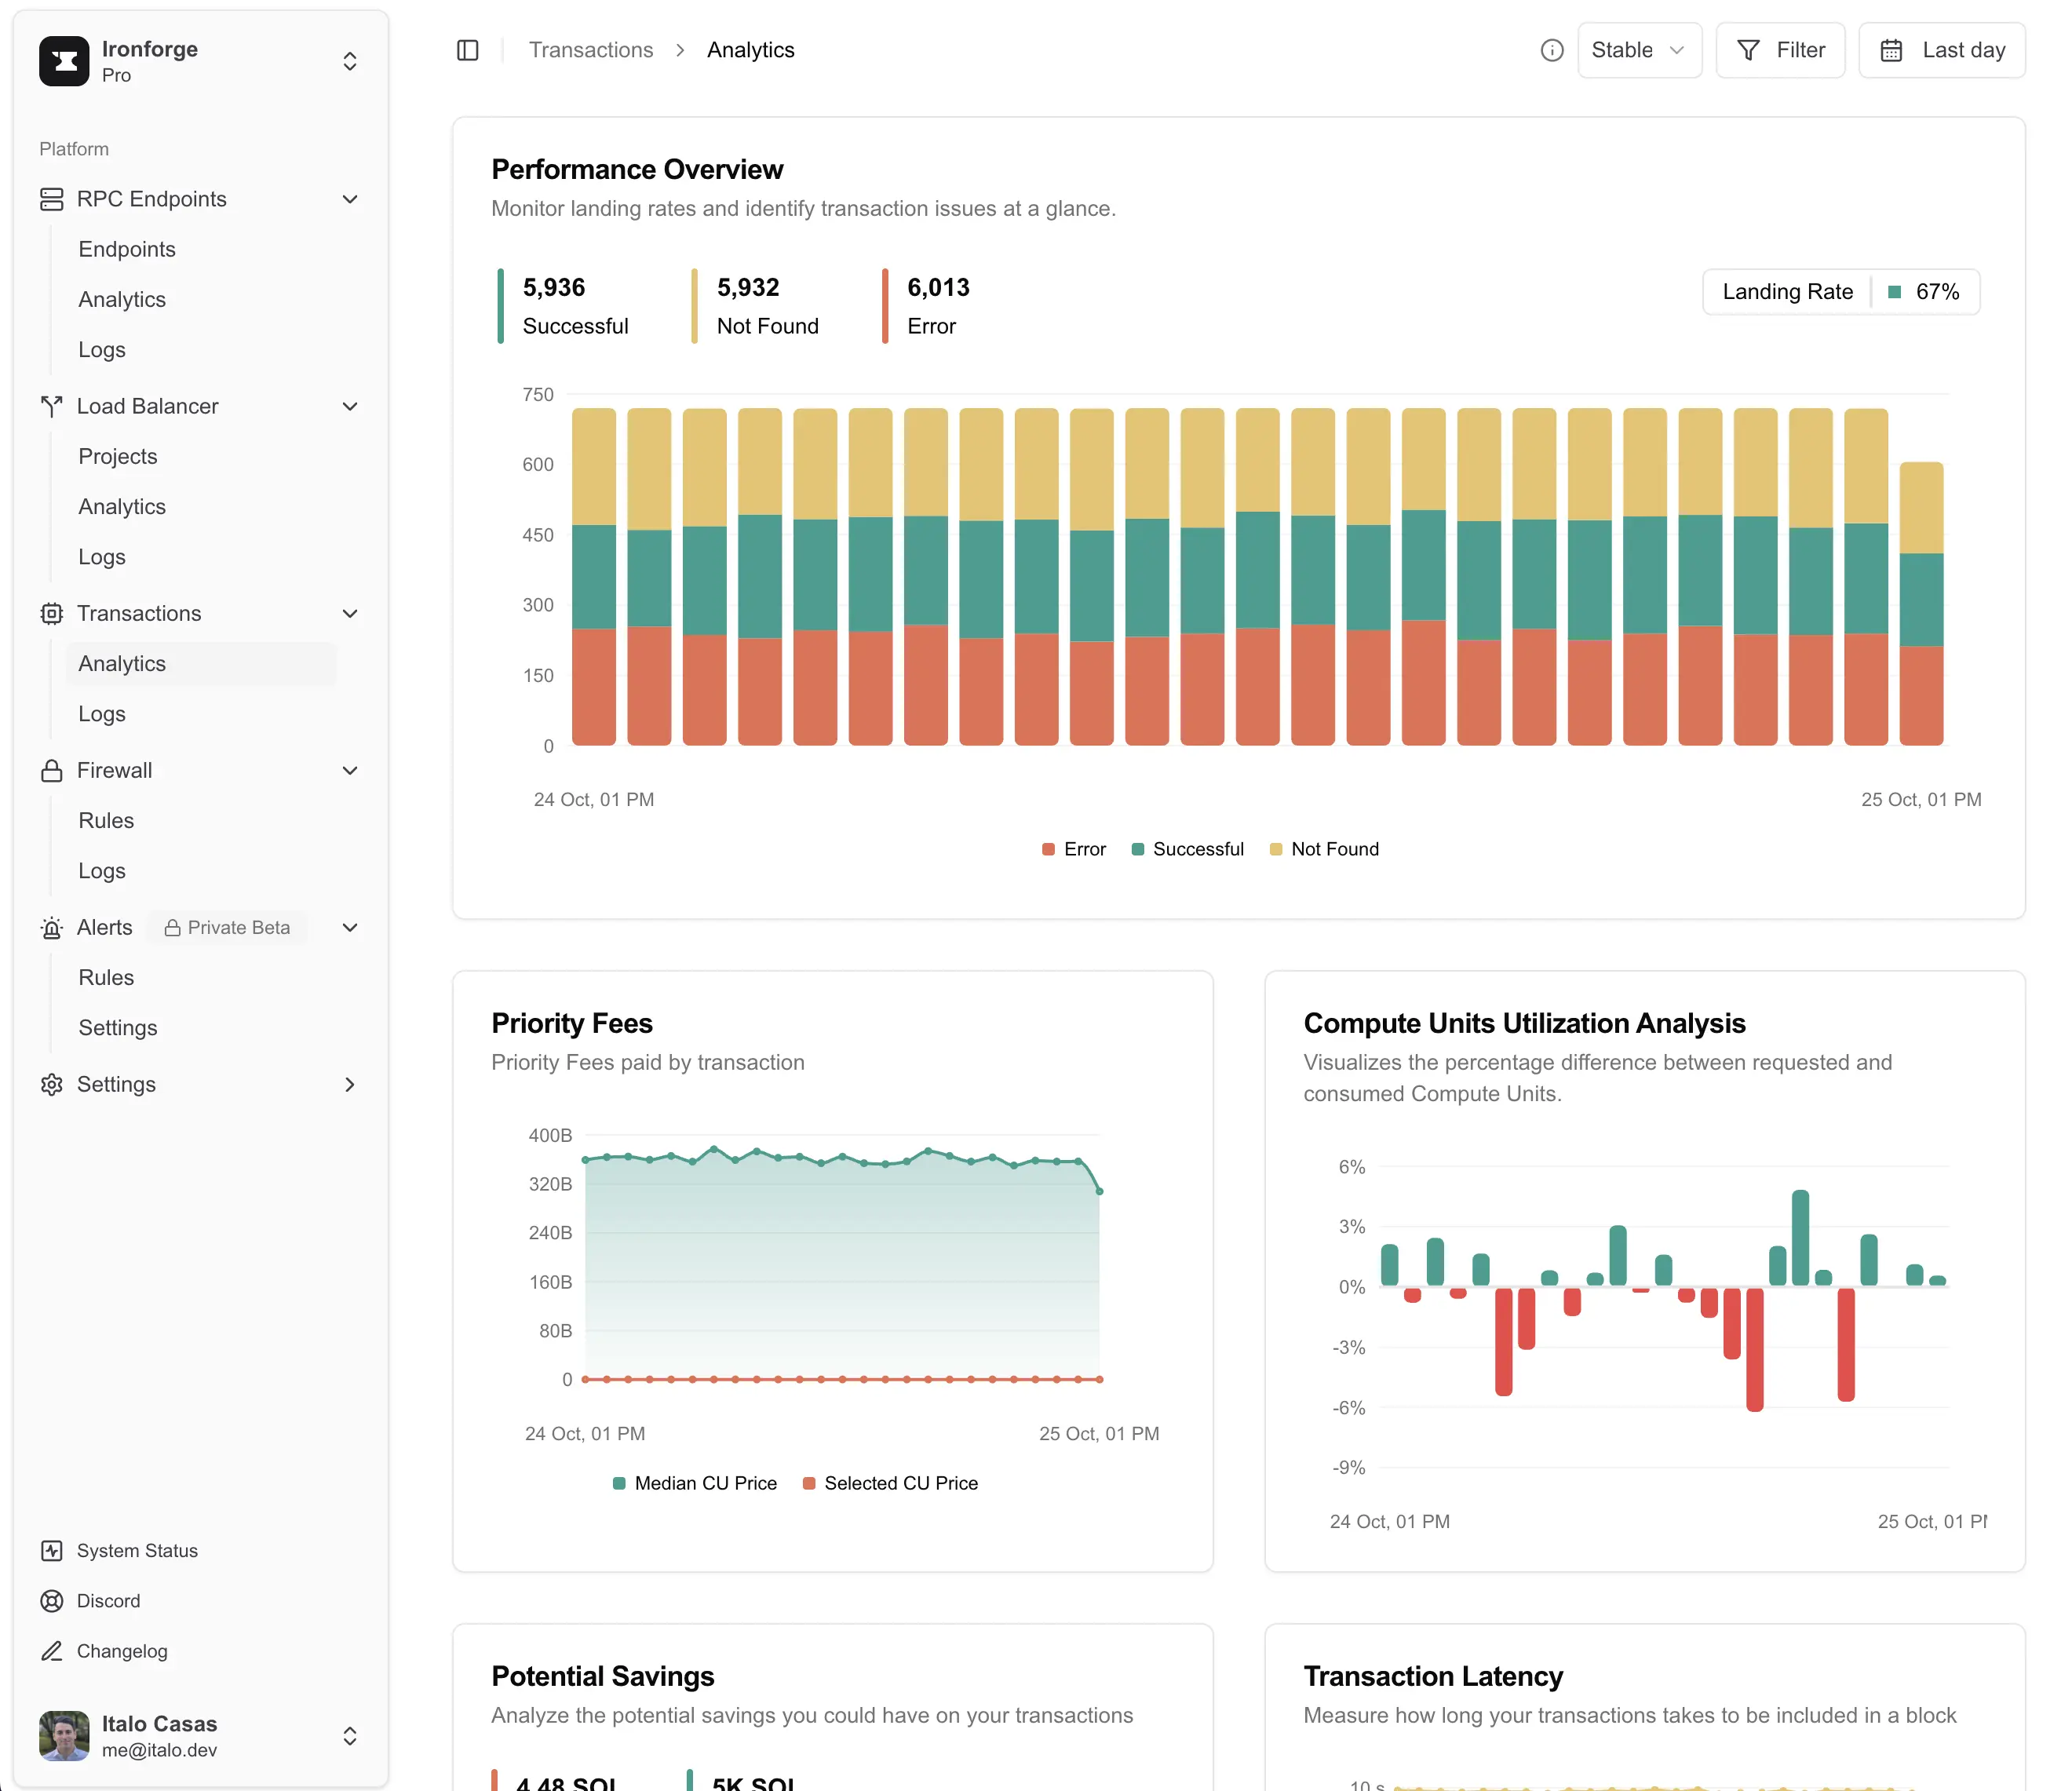
We've made significant improvements to the platform's UX, focusing on productivity and performance. The redesigned sidebar, refined color scheme, and optimized main layout create a more intuitive workspace.
Tip: Toggle the sidebar using Ctrl + B (Windows) or Cmd + B (Mac).

Data Pipeline version
You'll notice a new version selector at the top of analytics and logs pages. This feature lets you switch between stable and beta versions of our data pipeline.
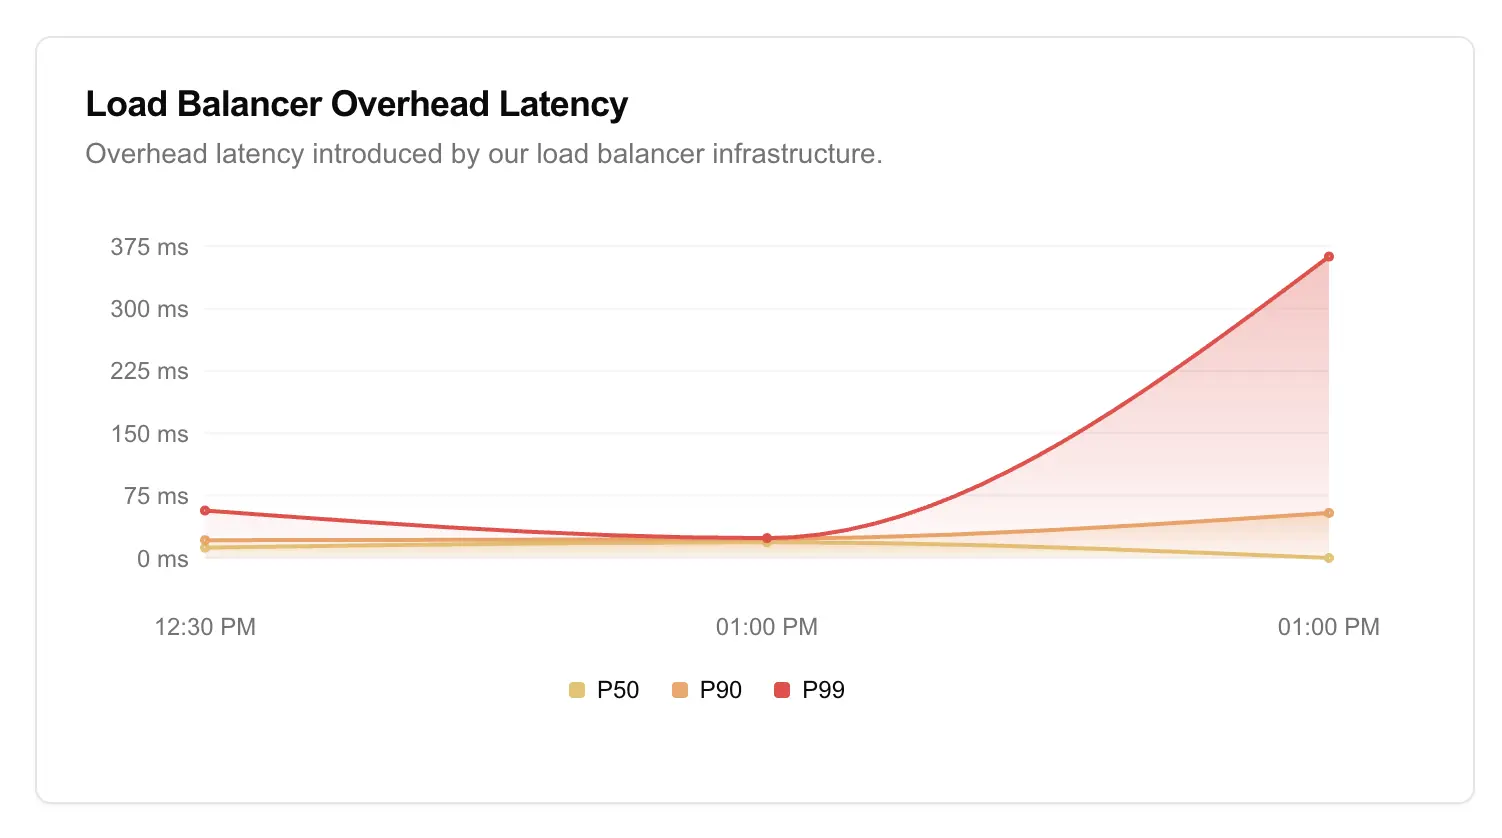
We're introducing a new development cycle where features spend a month in beta before moving to stable. This approach allows us to ship improvements faster while maintaining platform reliability. A prime example is our new Latency Overhead chart in the Load Balancer analytics, currently available in beta and scheduled for stable release in two weeks.

JSON RPC Request ID
Another small but useful feature that we added is that now we save the id that you pass in your JSON-RPC requests and allow you to filter the logs by it for both RPC Endpoints and Load Balancer making debugging and request tracing significantly easier.
What's next?
Our focus for the coming weeks is twofold:
- Refining Alerts based on user feedback and real-world usage patterns
- Rolling out improvements to usage tracking and billing systems
If you want to stay updated with our progress, you can follow us on Twitter or join our Discord