Analytics & Logs
Monitor and analyze how your RPC endpoints are performing.
Ironforge provides an Analytics & Logs tab under the RPC Endpoints section to constantly monitor the performance of your RPC endpoints.
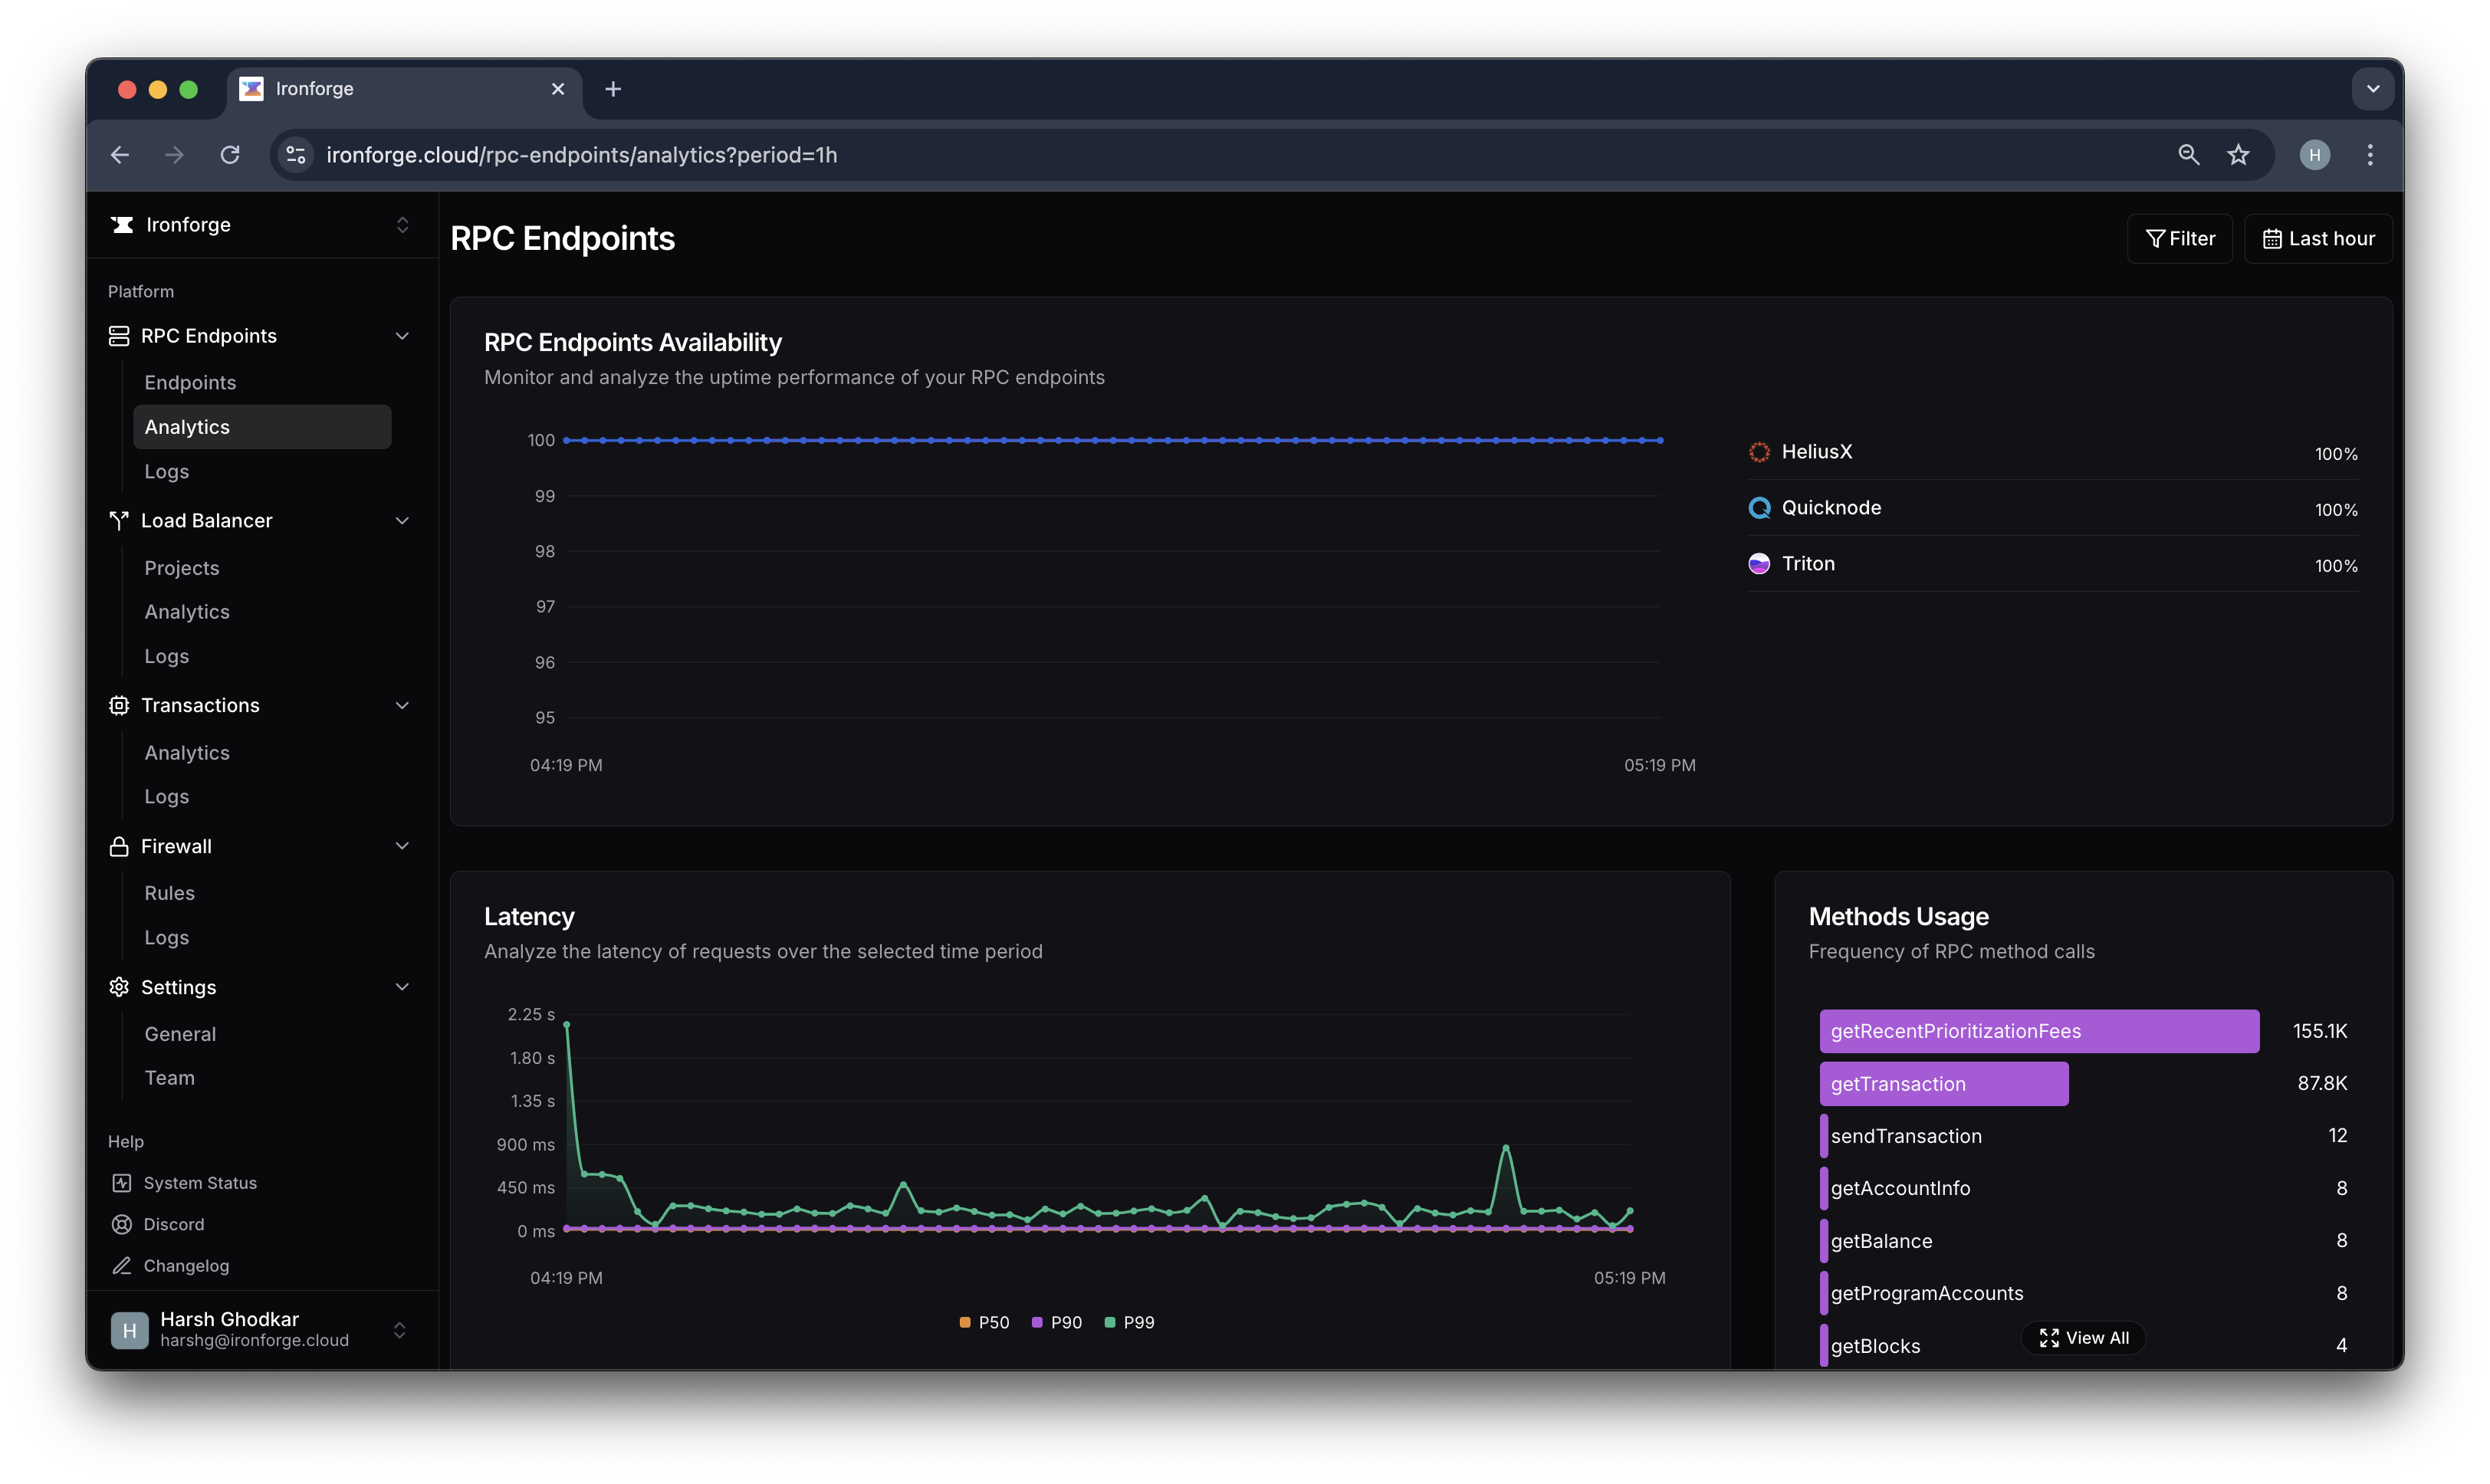
Analytics
The Analytics tab provides you with a detailed view of the performance of your RPC endpoints. You can view various metrics like
- RPC Endpoints Availability: Uptime percentage of your RPC endpoints.
- Latency: Latency in terms of p50, p90 and p99.
- Method Usage: Usage of different methods in your RPC requests.
- Request Per Second (RPS): Number of requests per second.
and so many more.
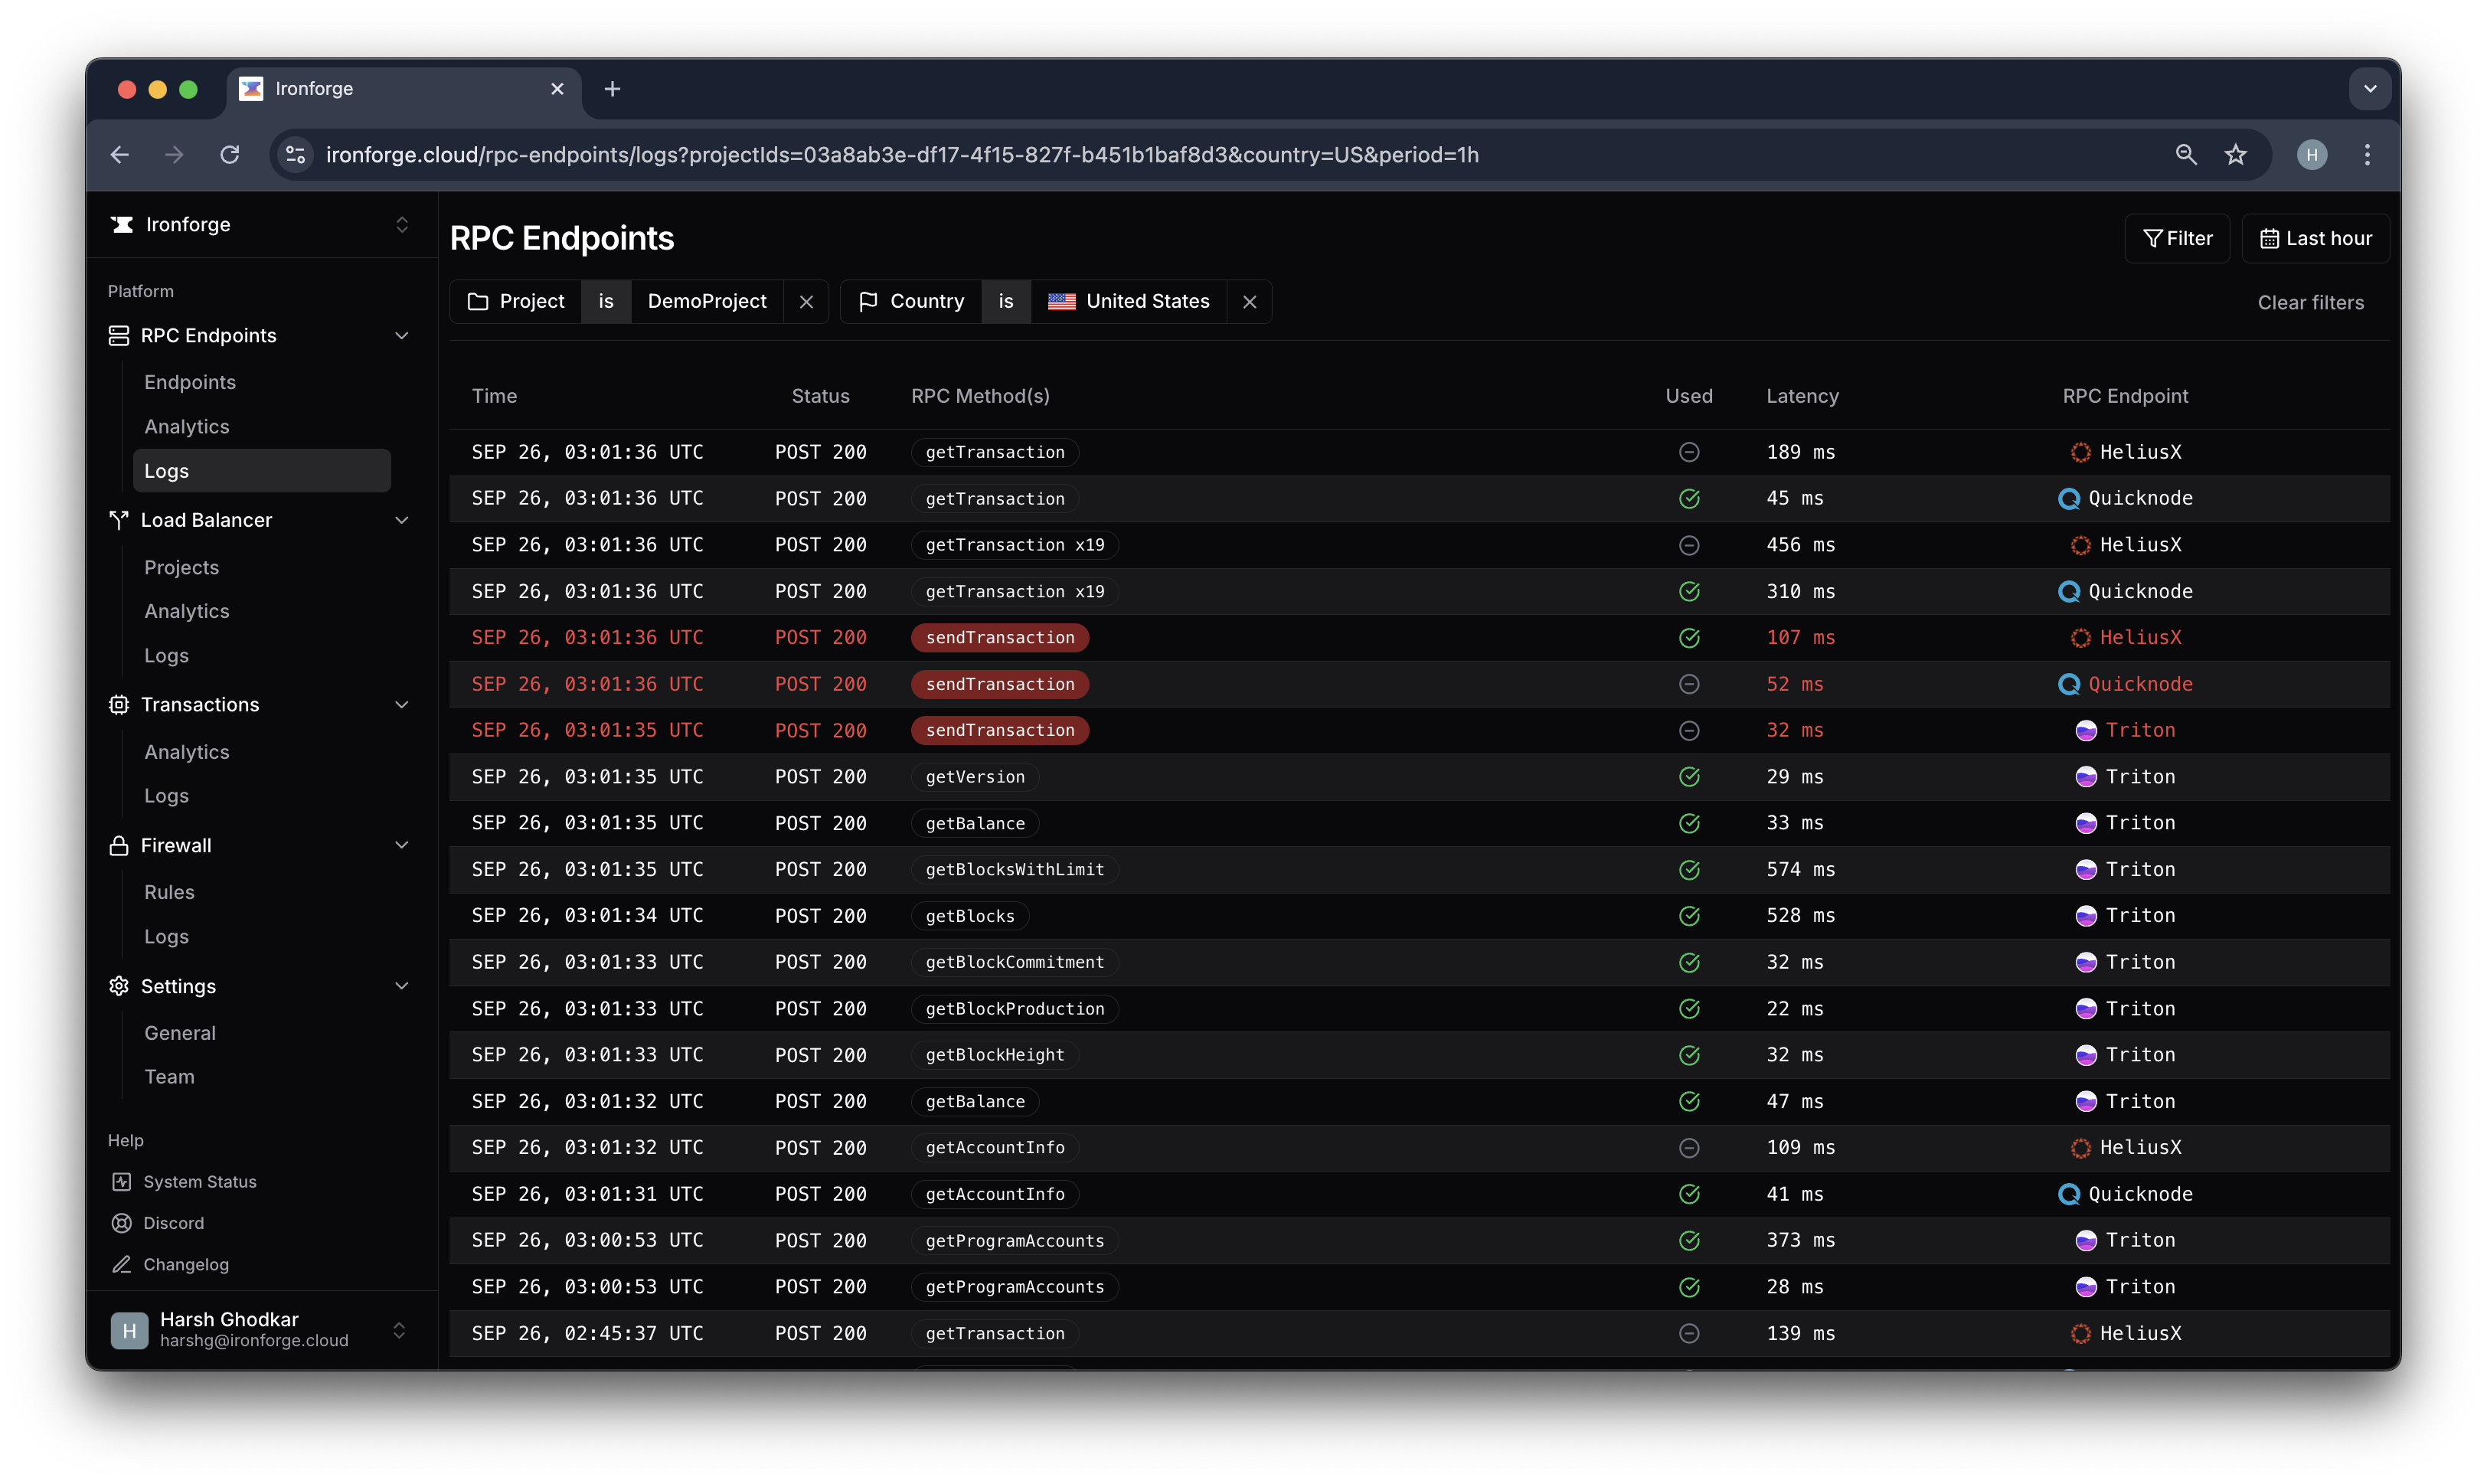
Logs
The Logs tab provides you with a comprehensive view of every request made to your RPC endpoints.
In the logs, you would find important information like the request method, response status, response time, and many more. To access your logs, navigate to the Logs tab in your project. Here you can inspect and filter your logs for every request made to your RPC endpoints.
Filtering Logs
The logs view provides a variety of filters to help you quickly identify and isolate issues. We provide filters like
- Time Range: Filter logs based on last 30 mins, hour, day.
- Cluster: Filter logs based on which cluster the request was made, i.e., devnet or mainnet.
- Project: Filter logs based on the project the request was made to.
- RPC Endpoint: Filter logs based on a specific RPC endpoint, useful for troubleshooting individual endpoints.
- API Key: Filter logs based on the API key used to make the request.
- Response Time: Filter logs based on response time, useful for identifying slow requests.
- RPC Method: Filters logs for specific RPC methods, useful for performance analysis or troubleshooting targeted operations.
- Response Status Code: Filters logs by HTTP status codes to isolate successes, client errors, or server errors.
- Country: Filter logs for requests made from specific countries, useful for troubleshooting regional issues.
- IP Address: Filter logs for requests made from specific IP addresses, useful for troubleshooting individual clients or identifying malicious traffic.
and many more.